注釈
最後まで をクリックすると完全なサンプルコードをダウンロードできます。
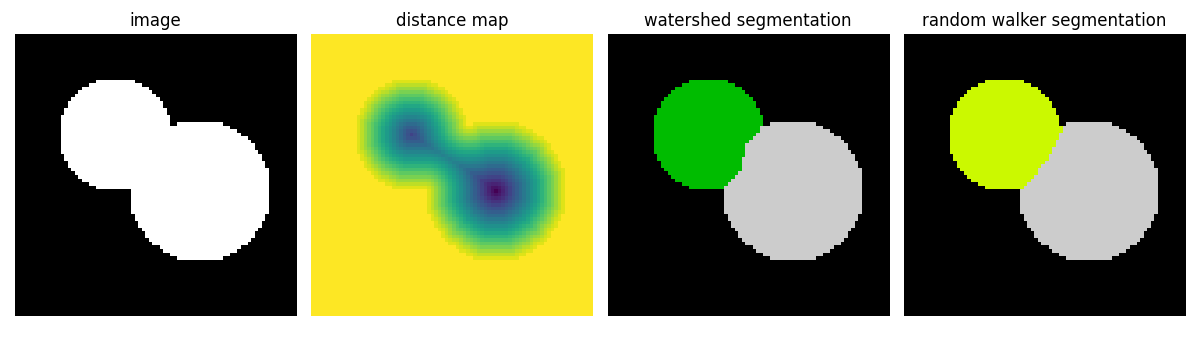
3.3.11.11. セグメンテーションのための分水嶺とランダムウォーカー
この例では、2つの連結した円盤を分離するために、2つのセグメンテーション法を比較します: 分水嶺アルゴリズムとランダムウォーカーアルゴリズム。
どちらのセグメンテーション手法も、曖昧性のない領域に属する画素であるシードを必要とします。ここでは、背景との距離マップの局所最大値がシードとして使用されます。
import numpy as np
from skimage.segmentation import watershed
from skimage.feature import peak_local_max
from skimage import measure
from skimage.segmentation import random_walker
import matplotlib.pyplot as plt
import scipy as sp

# Generate an initial image with two overlapping circles
x, y = np.indices((80, 80))
x1, y1, x2, y2 = 28, 28, 44, 52
r1, r2 = 16, 20
mask_circle1 = (x - x1) ** 2 + (y - y1) ** 2 < r1**2
mask_circle2 = (x - x2) ** 2 + (y - y2) ** 2 < r2**2
image = np.logical_or(mask_circle1, mask_circle2)
# Now we want to separate the two objects in image
# Generate the markers as local maxima of the distance
# to the background
distance = sp.ndimage.distance_transform_edt(image)
peak_idx = peak_local_max(distance, footprint=np.ones((3, 3)), labels=image)
peak_mask = np.zeros_like(distance, dtype=bool)
peak_mask[tuple(peak_idx.T)] = True
markers = measure.label(peak_mask)
labels_ws = watershed(-distance, markers, mask=image)

markers[~image] = -1
labels_rw = random_walker(image, markers)

plt.figure(figsize=(12, 3.5))
plt.subplot(141)
plt.imshow(image, cmap="gray", interpolation="nearest")
plt.axis("off")
plt.title("image")
plt.subplot(142)
plt.imshow(-distance, interpolation="nearest")
plt.axis("off")
plt.title("distance map")
plt.subplot(143)
plt.imshow(labels_ws, cmap="nipy_spectral", interpolation="nearest")
plt.axis("off")
plt.title("watershed segmentation")
plt.subplot(144)
plt.imshow(labels_rw, cmap="nipy_spectral", interpolation="nearest")
plt.axis("off")
plt.title("random walker segmentation")

plt.tight_layout()
plt.show()
Total running time of the script: (0 minutes 0.121 seconds)