注釈
最後まで をクリックすると完全なサンプルコードをダウンロードできます。
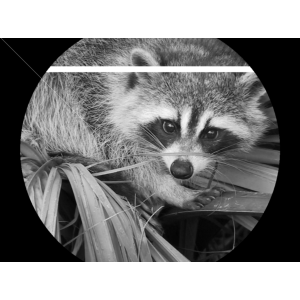
2.6.8.4. Image manipulation and NumPy arrays
This example shows how to do image manipulation using common NumPy arrays tricks.
import numpy as np
import scipy as sp
import matplotlib.pyplot as plt

face = sp.datasets.face(gray=True)
face[10:13, 20:23]
face[100:120] = 255

lx, ly = face.shape
X, Y = np.ogrid[0:lx, 0:ly]
mask = (X - lx / 2) ** 2 + (Y - ly / 2) ** 2 > lx * ly / 4
face[mask] = 0
face[range(400), range(400)] = 255

plt.figure(figsize=(3, 3))
plt.axes((0, 0, 1, 1))
plt.imshow(face, cmap="gray")
plt.axis("off")

plt.show()
Total running time of the script: (0 minutes 0.149 seconds)