注釈
最後まで をクリックすると完全なサンプルコードをダウンロードできます。
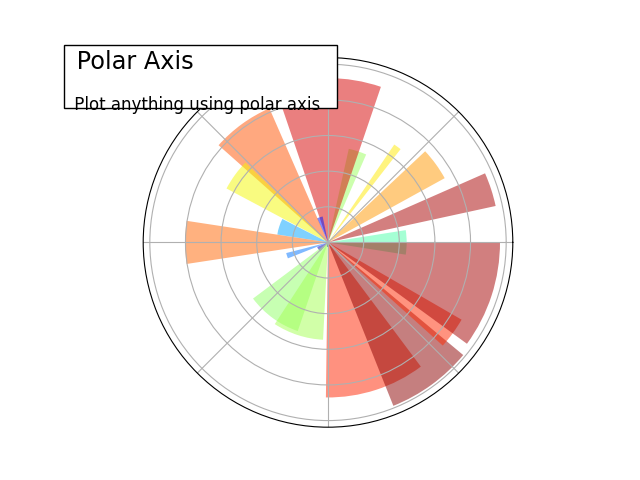
Plotting in polar, decorated
An example showing how to plot in polar coordinate, and some decorations.
import numpy as np

import matplotlib
import matplotlib.pyplot as plt


plt.subplot(1, 1, 1, polar=True)

N = 20
theta = np.arange(0.0, 2 * np.pi, 2 * np.pi / N)
rng = np.random.default_rng()
radii = 10 * rng.random(N)
width = np.pi / 4 * rng.random(N)
bars = plt.bar(theta, radii, width=width, bottom=0.0)
jet = matplotlib.colormaps["jet"]

for r, bar in zip(radii, bars, strict=True):
    bar.set_facecolor(jet(r / 10.0))
    bar.set_alpha(0.5)
plt.gca().set_xticklabels([])
plt.gca().set_yticklabels([])


plt.text(
    -0.2,
    1.02,
    " Polar Axis                  \n",
    horizontalalignment="left",
    verticalalignment="top",
    size="xx-large",
    bbox={"facecolor": "white", "alpha": 1.0},
    transform=plt.gca().transAxes,
)

plt.text(
    -0.2,
    1.01,
    "\n\n Plot anything using polar axis ",
    horizontalalignment="left",
    verticalalignment="top",
    size="large",
    transform=plt.gca().transAxes,
)

plt.show()
Total running time of the script: (0 minutes 0.067 seconds)